Difference between revisions of "Deep Learning for Cerebellar Ataxia Classification and Functional Score Regression"
(Added authors.) |
|||
| Line 1: | Line 1: | ||
<meta name="title" content="Deep Learning for Cerebellar Ataxia Classification and Functional Score Regression"/> | <meta name="title" content="Deep Learning for Cerebellar Ataxia Classification and Functional Score Regression"/> | ||
{{h2|Deep Learning for Cerebellar Ataxia classification and Functional Score regression}} | {{h2|Deep Learning for Cerebellar Ataxia classification and Functional Score regression}} | ||
| + | {{TOCright}} | ||
| + | |||
| + | [[Zhen|Zhen Yang]], Shenghua Zhong, {{iacl|~aaron|Aaron Carass}}, [[SarahYing|Sarah Ying]], [[Prince|Jerry L. Prince]] | ||
| − | |||
{{h3|Introduction}} | {{h3|Introduction}} | ||
Revision as of 01:53, 28 August 2014
<meta name="title" content="Deep Learning for Cerebellar Ataxia Classification and Functional Score Regression"/>
Deep Learning for Cerebellar Ataxia classification and Functional Score regression
Zhen Yang, Shenghua Zhong, Aaron Carass, Sarah Ying, Jerry L. Prince
Introduction
Cerebellar ataxia is a progressive neuro-degenerative disease that has multiple genetic versions, each with a characteristic pattern of anatomical degeneration that yields distinctive motor and cognitive problems. Studying this pattern of degeneration can help with the diagnosis of disease subtypes, evaluation of disease stage, and treatment planning. In tis work, we propose a learning framework using MR image data for discriminating a set of cerebellar ataxia types and predicting a disease related functional score.
Method
|
We train K weak classifiers/regressors on K image subdomains separately, and then learn a classifier/ regressor C to combine the decisions from weak classifiers. Each of the K image subdomains is a square plane of the same size, but with different locations and orientations. The image subdomains are chosen so that they are distributed evenly across the whole volume.
First, we start training weak classifier/regressor. They are on a set of image subdomains separately, and combining the weak classifier/regressors on a set of image subdomains separately, and combining the weak classifier/regressor outputs to make the decision.
Then we move on to training the combined classifier/regressor. Perturbing the image subdomain to increase the training samples. We do this by generating a training sample for C, for each image subdomain k. An image ![]() , is randomly selected from
, is randomly selected from ![]() . The selection is carried out independent among different image sub domains.
. The selection is carried out independent among different image sub domains. ![]() is in turn input into SAE to generate a feature vector
is in turn input into SAE to generate a feature vector ![]() , and weak classifier/regressor
, and weak classifier/regressor ![]() to generate an output. The feature vector for a training sample is then formed by concentrating the outputs from all
to generate an output. The feature vector for a training sample is then formed by concentrating the outputs from all ![]() . We then generate multiple training samples from each training subject by repeating the above procedure.
. We then generate multiple training samples from each training subject by repeating the above procedure.
|
Then comes the testing stage. Given the image of a test subject, multiple samples are generated in a similar way to process of generating training samples for the combined classifier/regressor C. Each training sample will be assigned by C the class probabilities in the case of classification or a predicted score in the case of regression. For classification, the final output is the class that has the maximum average class probability output by C from the multiple samples. For regression, the final score is the average score predicted by C from multiple samples.
Results
We started with cerebellar ataxia classification. In this experiment, we consider the classification problem of classifying four groups: HC, SCA2, SCA6, and AT. We applied a 10-fold cross validation on a dataset of 80 subjects. If you look at table one, you would see the proposed method had the best results, with an error rate of 13.75%. It outperforms the ROI volumetric analyses, indicating that high-dimensional data can reveal structural information that is not captured by the low-dimensional volumetric measurement. It also outperforms direct dimensionality reduction on the whole image or jacobian based features, which verifies the effectiveness of the proposed learning framework, and the strategies of dimensionality reduction and feature selection. Within the proposed learning framework, using SAE for dimensionality reduction outperformed PCA.
|
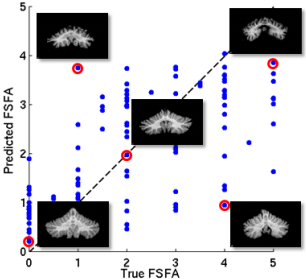
After testing cerebellar ataxia classification, we tested functional score regression. In this experiment we consider the regression of functional staging score for ataxia (FSFA) We applied a 10-fold cross validation on a dataset of 120 subjects which have FSFA evaluated evaluated. Five methods are comapared and table 2 shows that our proposed method with SAE outperforms the other methods in root mean square error (RMSE), and is compatible with the lobule volume PCA for Pearson’s correlation coefficient.
|
Conclusion
We presented a learning framework for MR image based classification of cerebellar ataxia types and prediction of a disease related functional score. We addressed he difficulty in analyzing high-dimensional image data with limited training subjects by: 1) training weak classifiers/regressors on a set of image subdomins separately, and combining the weak classifier/regressor outputs to make the decision; 2) perturbing the image subdomain to increase the training; 3)using stacked auto-encoder (SAE), a deep learning technique, to develop highly representative feature vectors of the input data. Experiments show that our approach can reliably classify between one of four categories (HC and three types of ataxia) and predict the functional staging score for ataxia.


