From IACL
Jump to: navigation, search

Statistical Characterization of Brain Tissues in Magnetic Resonance Imaging

D.L. Pham, J.L. Prince, A.P. Dagher, and C. Xu


Overview
An automated procedure for estimating the joint probability density function (pdf) of T1, T2, and proton spin density (PD) for gray matter (GM), white matter (WM), and cerebrospinal fluid (CSF) in the brain is presented. The pdf's are computed using a multispectral magnetic resonance imaging (MRI) data set of the brain followed by steps for estimating the tissue parameters and segmenting brain tissue. We show several examples applying the pdf's for the purposes of pulse sequence optimization, simulation of MR images, and comparing tissue parameter variability in normal and Alzheimer's subjects.
Introduction
Magnetic resonance imaging (MRI) is a highly successful diagnostic imaging modality, largely due to its ability to derive contrast from a number of physical parameters. An understanding of how these parameters vary with tissue type, pathology, and other factors is therefore fundamental to determining how MRI can best be used for diagnostic purposes.

In MRI, tissue contrast is based predominantly on the spin-lattice relaxation time (T1), spin-spin relaxation time (T2), and proton spin density (PD) of the tissues being imaged. Differences in these parameters, particularly in brain tissues, have been correlated with differences in age, sex, and disease. In addition, statistics on these parameters have been used in the optimization of pulse sequences for improved image contrast and segmentation. Further research is required on the variability of tissue parameters across populations and the evolution of parameters with pathology and age. Such research would provide invaluable information on not only biochemical processes and physiology, but also on how MR images can be interpreted and improved.

We describe a procedure for automatically estimating the conditional joint pdf of T1, T2, and PD, given that the tissue is either GM, WM, or CSF in the brain. A large number of tissue parameter estimates are accumulated using a multi-slice, multi-echo MRI acquisition. Two criteria are introduced for disregarding data which have been corrupted by partial volume averaging, noise, or other artifacts. The procedure is fully automated, making studies involving a large number of subjects feasible.

Procedure
Step 1: The procedure for estimating the conditional joint pdf's requires a multislice, multi-echo MRI data set of the brain.
Step 2: The data is then preprocessed to remove extracranial tissue. This is accomplished using a sequence of standard image processing operators.
Step 3: T1, T2, and PD parameter values are estimated by fitting the preprocessed data to an imaging equation. Along with parameter images, a q-value statistic is also computed which provides a measure of the goodness of fit at each pixel.
Step 4: A fuzzy c-means clustering is performed on the preprocessed data resulting from Step 2 to obtain a spatial map representing the membership value of the three tissue classes at each pixel location.
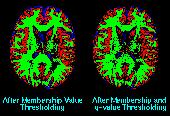
Step 5: Pixels with low membership values and low q-values are removed. This step rejects estimates which are not from pure tissue or have poor fits in the parameter estimation. The remaining parameter estimates are classified as either GM, WM, or CSF.
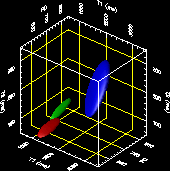
Step 6: Statistics are computed on the classified estimates to obtain a probability mass function and a Gaussian joint pdf of the tissue parameters for each tissue class. Another view of the pmf and pdf is available. (Red-GM, Green-WM, Blue-CSF)
Applications
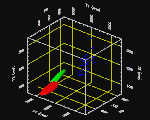
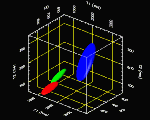
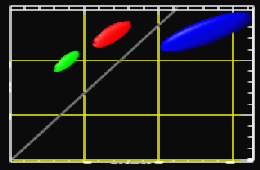
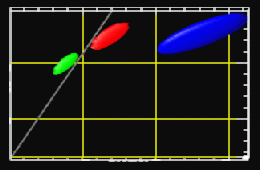
The pdf's can be used to visualize and optimize pulse sequences. Shown here are two plots of the isosurfaces of the joint pdf's along with an isosurface of a Spoiled GRASS (SPGR) pulse sequence (depicted as a straight line) taken at a two different image intensities. The SPGR isosurface represents all parameter values that give rise to the same intensity. Because SPGR is a T1-weighted pulse sequence, the T-2 axis is not shown. The plots show that in SPGR images, there is a clear intensity contrast between GM and CSF, but in some cases GM and WM intensities may slightly overlap. This demonstrates how the pdf's may be used to optimize pulse sequences, allowing one to maximimze contrast between tissue classes.

Visualization of Pulse Sequences

Visualization of Pulse Sequences

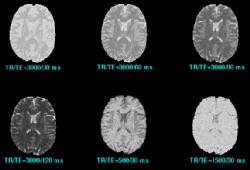
The pdf's can also be used to simulate MR images. This is accomplished by sampling the joint pdf's for parameter values, and then using imaging equations to obtain image intensities. MR images resulting from many different types of acquisitions can therefore be simulated. Click here to see some simulated images and here to see real MR data.
Simulated images
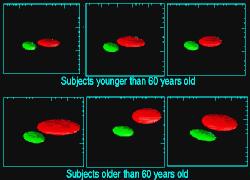
We have conducted a preliminary study looking at differences in the estimated pdf's between normal and elderly subjects. These results, some of which is shown here, indicate an apparent increase in T1 and T2 with age for GM and WM, as well as an increase in the variance of those distributions. The results also show that it may be desirable to "tune" pulse sequences according to a subject's age.
Simulated images
Conclusion
A procedure for characterizing the NMR tissue parameters of GM, WM, and CSF in the brain as a conditional joint pdf has been described. The procedure is completely automated and compensates for MRI artifacts by using two thresholding criteria. Example applications were shown employing the joint pdf's for studying the variability of tissue parameters across subjects, pulse sequence optimization, and computational phantoms. Additional experiments, including phantom studies, are necessary to establish the precision and accuracy of the procedure. A comprehensive longitudinal study across a large number of patients applying the procedure could prove highly revealing with respect to the variability of tissue parameters in the brain.
Publications
  1. D.L. Pham, J.L. Prince, A.P. Dagher, and C. Xu, ``An Automated Technique for Statistical Characterization of Brain Tissues in Magnetic Resonance Imaging,'' International Journal of Pattern Recognition and Artificial Intelligence, 11(8):1189-1211,1997.
  2. D.L. Pham, J.L. Prince, and A.P. Dagher, ``Estimation of Joint Probability Density Functions in Magnetic Resonance Imaging,'' Proceedings of The Ninth Workshop on Image and Multidimensional Signal Processing (IMDSP), pp. 148-149, 1996.
  3. J.L. Prince, Q. Tan and D. Pham, ``Optimization of MR Pulse Sequences for Bayesian Image SegmentationEstimation ,'' Medical Physics, vol 22, no.10, pp.1651-1656, October 1995.