Difference between revisions of "MGDM segmentation of macular OCT images"
(Linked to author pages.) |
|||
| Line 3: | Line 3: | ||
{{TOCright}} | {{TOCright}} | ||
| − | Aaron Carass, Andrew Lang, Matthew Hauser, Peter A. Calabresi, Howard S. Ying, and Jerry L. Prince | + | {{iacl|~aaron/|Aaron Carass}}, [[Andrew|Andrew Lang]], Matthew Hauser, Peter A. Calabresi, Howard S. Ying, and [[Prince|Jerry L. Prince]] |
''This page is under construction'' | ''This page is under construction'' | ||
| Line 9: | Line 9: | ||
{{h3|Introduction}} | {{h3|Introduction}} | ||
| + | Optical coherence tomography (OCT) is the de facto standard imaging modality for ophthalmological assessment of retinal eye disease, and is of increasing importance in the study of neurological disorders. Quantification of the thicknesses of various retinal layers within the macular cube provides unique diagnostic insights for many diseases but the capability for automatic segmentation and quantification remains quite limited. While manual segmentation has been used for many scientific studies, it is extremely time consuming and is subject t intra- and inter-rater variation. This paper presents a new computational domain, referred to as flat space, and a segmentation method for specific retinal layers in the macular cube using a recently developed deformable model approach for multiple objects. The framework maintains object relationships and topology while preventing overlaps and gaps. The algorithm segments eight retinal layers over the whole macular cube, where each boundary is defined with subvoxel precision. Evaluation of the method on single-eye OCT scans from 37 subjects, each with manual ground truth, shows improvement over a state-of-the-art method. | ||
| − | |||
| − | |||
{|align=center | {|align=center | ||
| Line 29: | Line 28: | ||
{{h3|Methods}} | {{h3|Methods}} | ||
| − | |||
| − | |||
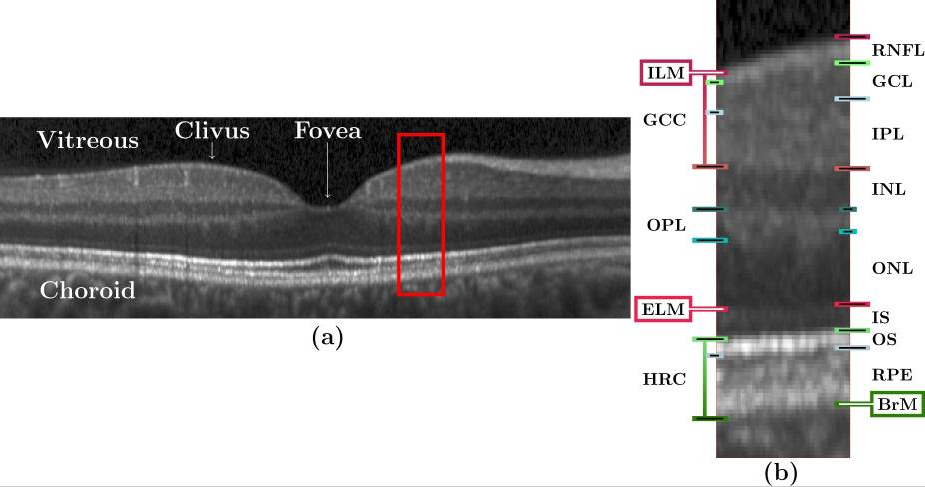
Our method builds upon our random forest (RF) based segmentation of the macula and also provides for a new computational domain which refer to as flat space. First we estimate the boundaries of the vitreous and choroid with the retina. From these estimated boundaries, we apply a mapping that was learned by regression on a collection of manual segmentations, which maps the retinal space between the vitreous and choroid to a domain in which each of the layers is approximately flat, referred to as flat space. In the original space we use the random forest layer boundary estimation to compute probabilities for the boundaries of each layer and then map them to flat space. These probabilities are then used to drive MGDM, providing a segmentation in flat space which is then mapped back to the original space. | Our method builds upon our random forest (RF) based segmentation of the macula and also provides for a new computational domain which refer to as flat space. First we estimate the boundaries of the vitreous and choroid with the retina. From these estimated boundaries, we apply a mapping that was learned by regression on a collection of manual segmentations, which maps the retinal space between the vitreous and choroid to a domain in which each of the layers is approximately flat, referred to as flat space. In the original space we use the random forest layer boundary estimation to compute probabilities for the boundaries of each layer and then map them to flat space. These probabilities are then used to drive MGDM, providing a segmentation in flat space which is then mapped back to the original space. | ||
Data from the right eyes of 37 subjects (a mixture of 16 healthy controls and 21 MS patients) were obtained using a Spectralis OCT system. Seven subjects from the cohort were picked at random and used to train the RF boundary classifier. The RF classifier has been previous [A. Lang et. al. 2013] shown to be robust and independent of the training data and thus should not have introduced any bias in the results. The research protocol was approved by the local Institutional Review Board, and written informed consent was obtained from all participants. All scans were screened and found to be free of microcystic macular edema, which is sometimes found in a small percentage of MS subjects. | Data from the right eyes of 37 subjects (a mixture of 16 healthy controls and 21 MS patients) were obtained using a Spectralis OCT system. Seven subjects from the cohort were picked at random and used to train the RF boundary classifier. The RF classifier has been previous [A. Lang et. al. 2013] shown to be robust and independent of the training data and thus should not have introduced any bias in the results. The research protocol was approved by the local Institutional Review Board, and written informed consent was obtained from all participants. All scans were screened and found to be free of microcystic macular edema, which is sometimes found in a small percentage of MS subjects. | ||
| + | |||
{|align=center | {|align=center | ||
| Line 51: | Line 49: | ||
{{h3|Experiments and Results}} | {{h3|Experiments and Results}} | ||
| + | We compared our multi-object geometric deformable models based approach to our previous work (RF+Graph) on all 37 subjects. In terms of computational performance, we are currently not competitive with RF+Graph which takes only four minutes on a 3D volume of a 49 B-scans. However, our MGDM implementation is written in a generic framework and an optimized method based on a GPU framework could offer 10 to 20 fold speed up. To compare the two methods, we computed the Dice coefficient of the automatically segmented layers against manual delineations. The Dice coefficient is a measure of how much the two segmentations agree with each other. It has a range of [0,1], with a score of 0 meaning complete contradiction between the two, while 1 represents complete concurrence. | ||
| − | |||
| − | |||
{|align=center | {|align=center | ||
| Line 68: | Line 65: | ||
|} | |} | ||
|} | |} | ||
| + | |||
The resulting Dice coefficients are shown in Table 1. It is observed that the mean Dice coefficient is larger for MGDM than RF+Graph in all layers. Further, we used a paired Wilcoxon rank sum test to compare the distributions of the Dice coefficients. The resulting p-values in Table 1 show that sic of the eight ayers reach significance (‘’a’’ level of 0.001). Therefore, MGDM is statistically better than RF+Graph in six of the eight layers. The two remaining layers (INL and OPL) lack statistical significance because of the large variance. | The resulting Dice coefficients are shown in Table 1. It is observed that the mean Dice coefficient is larger for MGDM than RF+Graph in all layers. Further, we used a paired Wilcoxon rank sum test to compare the distributions of the Dice coefficients. The resulting p-values in Table 1 show that sic of the eight ayers reach significance (‘’a’’ level of 0.001). Therefore, MGDM is statistically better than RF+Graph in six of the eight layers. The two remaining layers (INL and OPL) lack statistical significance because of the large variance. | ||
| Line 75: | Line 73: | ||
{{h3|Conclusion}} | {{h3|Conclusion}} | ||
| − | |||
The Dice coefficient and absolute boundary error in conjunction with the comparison to RF+GC suggest that our method has very good performance characteristics. Our new algorithm uses a multi-object geometric deformable model of the retinal layers in a unique computational domain, which we refer to as flat space. The forces used for each layer were built from the same principles. These could be refined or modified on a per-layer basis to help improve the results. | The Dice coefficient and absolute boundary error in conjunction with the comparison to RF+GC suggest that our method has very good performance characteristics. Our new algorithm uses a multi-object geometric deformable model of the retinal layers in a unique computational domain, which we refer to as flat space. The forces used for each layer were built from the same principles. These could be refined or modified on a per-layer basis to help improve the results. | ||
{{h3|Acknowledgments}} | {{h3|Acknowledgments}} | ||
| − | |||
| − | |||
This work was supported by the NIH/NEI R21-EY022150 and the NIH/NINDS R01-NS082347 | This work was supported by the NIH/NEI R21-EY022150 and the NIH/NINDS R01-NS082347 | ||
Revision as of 17:09, 18 June 2014
<meta name="title" content="MGDM segmentation of macular OCT images"/>
MGDM segmentation of macular OCT images
Aaron Carass, Andrew Lang, Matthew Hauser, Peter A. Calabresi, Howard S. Ying, and Jerry L. Prince
This page is under construction
Introduction
Optical coherence tomography (OCT) is the de facto standard imaging modality for ophthalmological assessment of retinal eye disease, and is of increasing importance in the study of neurological disorders. Quantification of the thicknesses of various retinal layers within the macular cube provides unique diagnostic insights for many diseases but the capability for automatic segmentation and quantification remains quite limited. While manual segmentation has been used for many scientific studies, it is extremely time consuming and is subject t intra- and inter-rater variation. This paper presents a new computational domain, referred to as flat space, and a segmentation method for specific retinal layers in the macular cube using a recently developed deformable model approach for multiple objects. The framework maintains object relationships and topology while preventing overlaps and gaps. The algorithm segments eight retinal layers over the whole macular cube, where each boundary is defined with subvoxel precision. Evaluation of the method on single-eye OCT scans from 37 subjects, each with manual ground truth, shows improvement over a state-of-the-art method.
Methods
Our method builds upon our random forest (RF) based segmentation of the macula and also provides for a new computational domain which refer to as flat space. First we estimate the boundaries of the vitreous and choroid with the retina. From these estimated boundaries, we apply a mapping that was learned by regression on a collection of manual segmentations, which maps the retinal space between the vitreous and choroid to a domain in which each of the layers is approximately flat, referred to as flat space. In the original space we use the random forest layer boundary estimation to compute probabilities for the boundaries of each layer and then map them to flat space. These probabilities are then used to drive MGDM, providing a segmentation in flat space which is then mapped back to the original space.
Data from the right eyes of 37 subjects (a mixture of 16 healthy controls and 21 MS patients) were obtained using a Spectralis OCT system. Seven subjects from the cohort were picked at random and used to train the RF boundary classifier. The RF classifier has been previous [A. Lang et. al. 2013] shown to be robust and independent of the training data and thus should not have introduced any bias in the results. The research protocol was approved by the local Institutional Review Board, and written informed consent was obtained from all participants. All scans were screened and found to be free of microcystic macular edema, which is sometimes found in a small percentage of MS subjects.
|
Experiments and Results
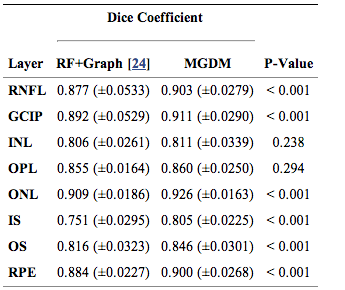
We compared our multi-object geometric deformable models based approach to our previous work (RF+Graph) on all 37 subjects. In terms of computational performance, we are currently not competitive with RF+Graph which takes only four minutes on a 3D volume of a 49 B-scans. However, our MGDM implementation is written in a generic framework and an optimized method based on a GPU framework could offer 10 to 20 fold speed up. To compare the two methods, we computed the Dice coefficient of the automatically segmented layers against manual delineations. The Dice coefficient is a measure of how much the two segmentations agree with each other. It has a range of [0,1], with a score of 0 meaning complete contradiction between the two, while 1 represents complete concurrence.
|
The resulting Dice coefficients are shown in Table 1. It is observed that the mean Dice coefficient is larger for MGDM than RF+Graph in all layers. Further, we used a paired Wilcoxon rank sum test to compare the distributions of the Dice coefficients. The resulting p-values in Table 1 show that sic of the eight ayers reach significance (‘’a’’ level of 0.001). Therefore, MGDM is statistically better than RF+Graph in six of the eight layers. The two remaining layers (INL and OPL) lack statistical significance because of the large variance.
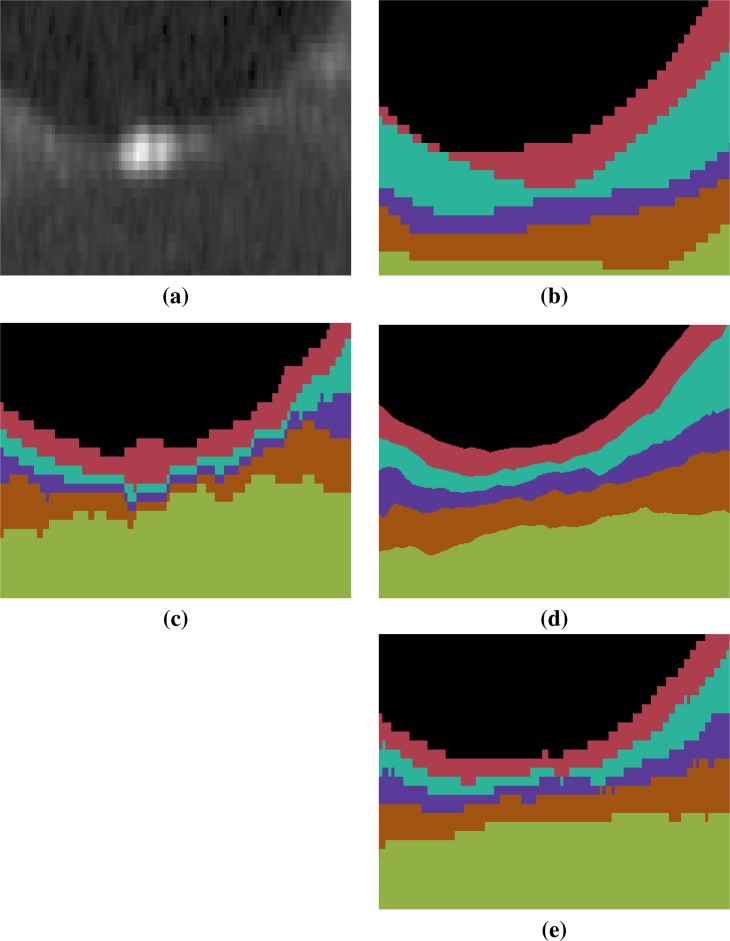
An example of the manual delineations as well as the result of our method on the same subject are shown in Fig 3, with a magnified region about the fovea in Fig 4. Table 2 includes the absolute boundary error for the nine boundaries we approximate; these errors are measured along the A-scans in comparison to the same manual rater. We, again, used a paired Wilcoxon rank sum test to compute p-values between the two methods for the absolute distance error, six of the nine boundaries reach significance (‘’a’’ level of 0.001).
Conclusion
The Dice coefficient and absolute boundary error in conjunction with the comparison to RF+GC suggest that our method has very good performance characteristics. Our new algorithm uses a multi-object geometric deformable model of the retinal layers in a unique computational domain, which we refer to as flat space. The forces used for each layer were built from the same principles. These could be refined or modified on a per-layer basis to help improve the results.
Acknowledgments
This work was supported by the NIH/NEI R21-EY022150 and the NIH/NINDS R01-NS082347
Publications
- A. Carass, A. Lang, M. Hauser, P.A. Calabresi, H.S. Ying, and J.L. Prince, "Multiple-object geometric deformable model for segmentation of macular OCT", Biomedical Optics Express, 5(4): 1062-1074, 2014. (doi)
- A. Lang, A. Carass, M. Hauser, E.S. Sotirchos, P.A. Calabresi, H.S. Ying, and J.L. Prince, "Retinal layer segmentation of macular OCT images using boundary classification", Biomedical Optics Express, 4(7): 1133-1152, 2013. (doi)
- M. Chen, A. Lang, E. Sotirchos, H.S. Ying, P.A. Calabresi, J.L. Prince, and A. Carass, "Deformable registration of macular OCT using A-mode scan similarity", Tenth IEEE International Symposium on Biomedical Imaging (ISBI 2013), San Francisco, CA, April 7 - 11, 2013.
- A. Lang, A. Carass, E. Sotirchos, P. Calabresi, and J.L. Prince, "Segmentation of retinal OCT using a random forest classifier", Proceedings of SPIE Medical Imaging (SPIE-MI 2013), Orlando, FL, February 9-14, 2013.
- A. Lang, A. Carass, P.A. Calabresi, H.S. Ying, and J.L. Prince, "An adaptive grid for graph-based segmentation in macular cube OCT", Proceedings of SPIE Medical Imaging (SPIE-MI 2014), San Diego, CA, February 15-20, 2014.
- J.A. Bogovic, J.L. Prince, and P.-L. Bazin, "A multiple object geometric deformable model for image segmentation", Template:Iacl-pub Computer Vision and Image Understanding, 117(2):145-157, 2013. (PubMed)


