Automatic segmentation of microcystic macular edema in OCT
<meta name="title" content="Automatic Segmentation of Microcystic macular edema in OCT"/>
Automatic Segmentation of Microcystic macular edema in OCT
Andrew Lang, Aaron Carass, Emily K. Swingle, Omar Al-Louzi, Pavan Bhargava, Shiv Saidha, Howard S. Ying, Peter A. Calabresi, and Jerry L. Prince
**This web page is under construction**
Introduction
To the best of our knowledge, there are no reports outside of our own prior work (Swingle et. al.) describing the automatic segmentation of pseudocysts in Microcystic Macular Edema (MME), a form of Macular Edema present in about 5% of all Multiple Sclerosis (MS) patients. A variety of methods for the segmentation of more general cystic changes in the retina have been reported, in paticular methods for segmentation in diabetic macular edema, retinal detachment, and age related macular degeneration (Fernandez) (Zheng et. al.) (Chen et. al.) (Chiu et. al.)(Wilkins et. al.) (Pilch et. al.). These methods use a variety of techniques to segment the cystoid spaces, but the cysts found using these algorithms for their targeted diseases are generally much larger than pseudocysts found in MS and therefore these existing methods are inappropriate for application to MME in MS. In this paper we present a segmentation algorithm for the detection of pseudocysts due to MME in macular OCT scans acquired on the Spectralis scanner. Our algorithm leverages the ability of a random forest classifier (RFC) to learn the probability that a pixel belongs to a pseudocyst given a set of features. The presented method improves on our previous algorithm (Swingle et. al.) and includes a validation study on a larger cohort of subjects.
Method
We will now overview our algorithm for automatically segmenting pseudocysts from macular OCT images. Our method follows a pixel classification approach. For each pixel in a given B-scan, we compute several different features which a classifier then uses to decide which class the pixel belongs to—the two classes being pseudocysts or background. We use a RFC to do this classification (Breiman). The RF algorithm was chosen for several reasons including its comparable accuracy to other state-of-the-art algorithms, its simplicity and efficiency, the relatively small number of turnable parameters, and a history of successful use for image segmentation tasks, including OCT-related applications (Lang. et. al.) (Antony et. al.). Also, the RFC outputs a soft classification, or probability, instead of only a binary result, providing a measure of confidence at each pixel that we will take advantage of.
|
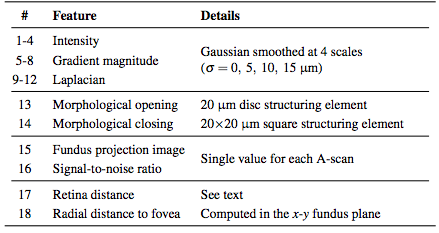
Before classifying the pixels, we first normalize the intensities of each volume to provide better consistency both between subjects and between B-scans of the same subject. After this normalization, we compute a set of 18 features at each pixel (16 being derived from intensities and 2 from the spatial position). The list of features implemented can be found in Table 1. The features are used by the RFC to generate MME probability maps for each image. We then follow a three stage threshold scheme to produce the final segmentation of the data. First, the resulting RFC probabilities are thresholded at a value of 0.5 to generate candidate cystic lesions. This threshold was empirically chosen to represent a majority voting scheme commonly used for binary classification problems. A second threshold is used to remove any connected regions (defined using 8-connectivity) that do not have any pixels with a probability of greater than 0.85. Thus, we encourage only those pseudocysts that are highly probable. Due to the noise and variability of the pseudocyst appearance, we do not expect a high probability everywhere within a given lesion. As a final step, we remove all connected components with fewer than 5 pixels thus removing spurious areas potentially found due to noise. All remaining pixels are then classified as pseudocysts. This final threshold makes sense since there were very few (25 total) manually delineated pseudocysts smaller than this threshold.
Results
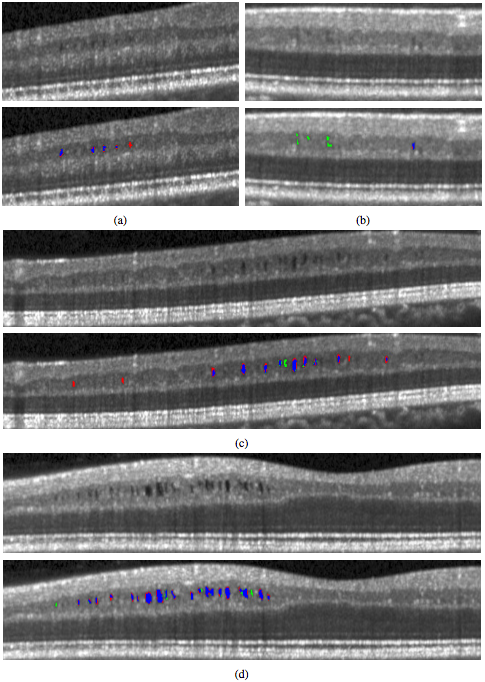
To explore the performance of the algorithm, we used a leave-one-out approach for training the classifier. Since we had data from nine subjects, we left one subject out instead of one scan to avoid any bias that including the opposite eye may introduce. Thus, each classifier was trained on data from eight scans. For subjects with scans from both eyes, either the left or right eye was randomly used. However evaluations were done on all 12 scans. To additionally show how the algorithm performs on data without MME, we ran the algorithm on 10 healthy control (HC) subjects and 10 MS patients, with each scan manually examined and found not to have any pseudocysts. The classifier for these experiments was trained on data from all of the subjects (9 scans). Table 2 lists the results of the algorithm both divided into the low and high density groups as well as the overall results. The measures are generally lower for the low density subjects with a larger spread as measured by the interquartile range (IQR). We also looked at the total MME volume, the total number of MME pixels in each scan. Comparing the manual and automatic segmentation, we get a correlation coefficient of 0.98(p < 1 x 10⁻⁷) which indicates excellent agreement. Table 3 shows a comparison of the differences between the algorithm and ground truth where we see that the algorithm consistently underestimates the volume for the low density subjects and overestimates for the high density subjects. Since the low density subjects generally have smaller pseudocysts which are more difficult to segment, the total volume difference in the high density subjects can also partially be attributed to overestimation of the pseudocyst size by the algorithm. In Fig. 4, we display the results of the algorithm on one B-scan each from four subjects, two low and two high density subjects. While the algorithm clearly has no trouble finding the larger, darker pseudocysts, many of the false negatives and false positives are due to having a much lighter appearance. Indeed many of the false positives could be argued to actually be pseudocysts but were simply not designated so by the rater. Also note the general appearance of a red ring around the pseudocysts indicating that the algorithm found slightly larger lesions.
|
Conclusion
In this work, we developed an automated algorithm for segmentation of MME in macular OCT scans with a focus on data from the Spectralis scanner. The performance was quite good, finding 79% of the pseudocysts within the data. Using a simple classifier based only on the number of pseudocysts found, the classifier correctly labeled all of the non-MME data. While the algorithm is straightforward, using an RFC in a pixel-wise fashion, the addition of a novel intensity normalization method proved to increase the performance of the algorithm. The major limitation of this study was the amount of MME scans available to use. More data would allow us to include more training data for the RFC which could improve both the accuracy and robustness of the algorithm. Finally we note that although the proposed algorithm has been developed for segmentation of MME specifically, it should be able to identify larger cysts found in other eye diseases removal of the spatial features may be necessary in these cases, especially if the cysts are not expected to appear in a consistent location within the retina.
Acknowledgments
This work was supported by the NIH/NEI under grants R21-EY022150 & R01-EY024655 and the NIH/NINDS under grant R01-NS082347
References
- E.K. Swingle, A. Lang, A. Carass, P.A. Calabresi, H.S. Ying, and J.L. Prince. Microcystic macular edema detection in retina OCT images. Proc. SPIE 9038. 903800, 2014.
- D. Fernandez. Delineating fluid-filled region boundaries in optical coherence tomography images of the retina. IEEE Trans. Med. Imag. 24, 929-945, 2005.
- Y. Zheng, J. Sahni, C. Campa A.N. Stangos, A. Raj, and S.P. Harding. computerized assessment of intraretinal and subretinal fluid regions in spectral-domain optical coherence tomography images of the retina. Am. J. Ophthalmol. 155, 277-286, 2013.
- X. Chen, M. Niemeijer, L. Zhang, K. Lee, M. Abramoff, and M. Sonka. Three-dimensional segmentation of fluid-associated abnormalities in retinal OCT: Probability constrained graph-search-graph-cut. IEEE Trans. Med. Imag. 31, 1521-1531, 2012.
- S.J. Chiu, C.A. Toth, C.B. Rickman, J.A. Izalt, and S. Farsiu. Automatic segmentation of closed-contour features in ophthalmic images using graph theory and dynamic programming. Biomed. Opt. Express. 3, 1127-1140, 2012.
- G. Wilkins, O Houghton, and A. Oldenburg. Automated segmentation of intraretinal cystoid fluid in optical coherence tomography. IEEE Trans. Biomed. Eng. 59, 1109-1114, 2012.
- M. Pilch, K. Stieger, Y. Wenner M.N. Preising, C. Friedburg, E. Meyer zu Bexten, and B. Lorenz. Automated segmentation of pathological cavities in optical coherence tomography scans. Invest. Opthalmol. Vis. Sci. 54, 4385-4393, 2013.
- A. Lang, A. Carass, M. Hauser, E.S. Sortirchos, P.A. Calabresi, H.S. Ying, and J.L. Prince. Retinal layer segmentation of macular OCT images using boundary classification. Biomed. Opt. Express. 4, 1133-1152, 2013.
- B.J. Antony, M.D. Abramoff, M.M. Harper, W. Jeong, E.H. Sohn, Y.H. Kwon, R. Kardon, and M.K. Garvin. A combined machine-learning and graph based framework for the segmentation of retinal surfeces in SD-OCT volumes. Biomed. Opt. Express. 4, 2712-2728, 2013.
- L. Breiman. Random forests. Machine Learning. 45, 5-32, 2001.


