Longitudinal changes in cortical thickness associated with normal aging
M. Thambisetty, J. Wan, A. Carass, Y. An, J.L. Prince and S.M. Resnick
Overview
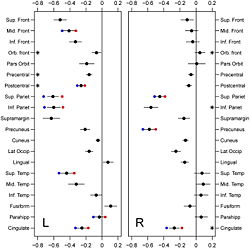
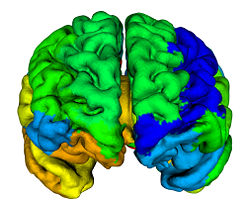
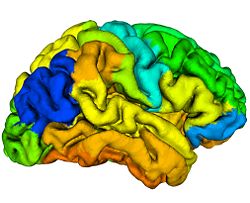
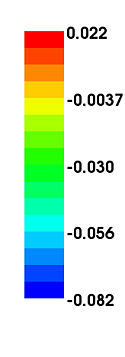
Imaging studies of anatomic changes in regional gray matter volumes and cortical thickness have documented age effects in many brain regions, but the majority of such studies have been cross-sectional investigations of individuals studied at a single point in time. In this study, using serial imaging assessments of participants in the Baltimore Longitudinal Study of Aging (BLSA), we investigate longitudinal changes in cortical thickness during aging in a cohort of 66 older adults (mean age 68.78; sd. 6.6; range 60–84 at baseline) without dementia. We used the Cortical Reconstruction Using Implicit Surface Evolution CRUISE suite of algorithms to automatically generate a reconstruction of the cortical surface and identified twenty gyral based regions of interest per hemisphere. Using mixed effects regression, we investigated longitudinal changes in these regions over a mean follow-up interval of 8 years. The main finding in this study is that age-related decline in cortical thickness is widespread, but shows an anterior–posterior gradient with frontal and parietal regions, in general, exhibiting greater rates of decline than temporal and occipital. There were fewer regions in the right hemisphere showing statistically significant age-associated longitudinal decreases in mean cortical thickness. Males showed greater rates of decline in the middle frontal, inferior parietal, parahippocampal, postcentral, and superior temporal gyri in the left hemisphere, right precuneus and bilaterally in the superior parietal and cingulate regions. Significant nonlinear changes over time were observed in the postcentral, precentral, and orbitofrontal gyri on the left and inferior parietal, cingulate, and orbitofrontal gyri on the right.
Introduction
Neuroimaging methods to assess brain atrophy have been extensively applied to track the onset and progression of neurodegenerative conditions such as Alzheimer's disease (AD) <ref name="Callen2001">D.J. Callen, S.E. Black, F. Gao, C.B. Caldwell, and J.P. Szalai, "Beyond the hippocampus: MRI volumetry confirms widespread limbic atrophy in AD", Neurology, 57:669–1674, 2001.</ref><ref name="DeSanti2001>S. De Santi, M.J. de Leon, H. Rusinek, A. Convit, C.Y. Tarshish, A. Roche, W.H. Tsui, E. Kandil, M. Boppana, K. Daisley, G.J. Wang, D. Schlyer, and J. Fowler, "Hippocampal formation glucose metabolism and volume losses in MCI and AD", Neurobiol. Aging, 22:529–539, 2001.</ref><ref name="Du2001">A.T. Du, N. Schuff, D. Amend, M.P. Laakso, Y.Y. Hsu, W.J. Jagust, K. Yaffe, J.H. Kramer, B. Reed, D. Norman, H.C. Chui, and M.W. Weiner, "Magnetic resonance imaging of the entorhinal cortex and hippocampus in mild cognitive impairment and Alzheimer's disease", J. Neurol. Neurosurg. Psychiatry, 71:441–447, 2001.</ref><ref name="Soininen1994">H.S. Soininen, K. Partanen, A. Pitkanen, P. Vainio, T. Hanninen, M. Hallikainen, K. Koivisto, and P.J. Riekkinen Sr., "Volumetric MRI analysis of the amygdala and the hippocampus in subjects with age-associated memory impairment: correlation to visual and verbal memory", Neurology, 44:1660–1668, 1994.</ref>. Longitudinal analyses have proven especially useful in delineating changes in brain volume during normal aging <ref name="Resnick2003">S.M. Resnick, D.L. Pham, M.A. Kraut, A.B. Zonderman, and C. Davatzikos, "Longitudinal magnetic resonance imaging studies of older adults: a shrinking brain", J. Neurosci., 23:3295–3301, 2003.</ref>, as well as in evaluating the temporal progression of neuropathology in AD <ref name="Driscoll2009">I. Driscoll, C. Davatzikos, Y. An, X. Wu, D. Shen, M. Kraut and S.M. Resnick, "Longitudinal pattern of regional brain volume change differentiates normal aging from MCI", Neurology, 72:1906–1913, 2009.</ref><ref name="Fox2000">N.C. Fox, S. Cousens, R. Scahill, R.J. Harvey, and M.N. Rossor, "Using serial registered brain magnetic resonance imaging to measure disease progression in Alzheimer disease: power calculations and estimates of sample size to detect treatment effects", Arch. Neurol., 57:339–344, 2000.</ref><ref name="Jack2004">C.R. Jack Jr., M.M. Shiung, J.L. Gunter, P.C. O'Brien, S.D. Weigand, D.S. Knopman, B.F. Boeve, R.J. Ivnik, G.E. Smith, R.H. Cha, E.G. Tangalos, and R.C. Petersen,, "Comparison of different MRI brain atrophy rate measures with clinical disease progression in AD", Neurology, 62:591–600, 2004.</ref><ref name="Misra2009">C. Misra, Y. Fan, and C. Davatzikos, "Baseline and longitudinal patterns of brain atrophy in MCI patients, and their use in prediction of short-term conversion to AD: results from ADNI", Neuroimage, 44:1415–1422, 2009.</ref><ref name="Mungas2005">D. Mungas, D. Harvey, B.R. Reed, W.J. Jagust, C. DeCarli, L. Beckett, W.J. Mack, J.H. Kramer, M.W. Weiner, N. Schuff, and H.C. Chui, "Longitudinal volumetric MRI change and rate of cognitive decline", Neurology, 65:565–571, 2005.</ref><ref name="Schott2005">J.M. Schott, S.L. Price, C. Frost, J.L. Whitwell, M.N. Rossor and N.C. Fox, "Measuring atrophy in Alzheimer disease: a serial MRI study over 6 and 12 months", Neurology, 65:119–124, 2005.</ref>. In older individuals, longitudinal decreases in gray and white matter volumes are widespread, and these declines are observed even in very healthy subjects during normal aging<ref name="Resnick2003"/>. In AD, the rates of whole brain atrophy are several times greater than age-matched controls and differentiate the two groups with sensitivity greater than 90%<ref name="FoxFreeborough1997">N.C. Fox and P.A. Freeborough, "Brain atrophy progression measured from registered serial MRI: validation and application to Alzheimer's disease", J. Magn. Reson. Imaging, 7:1069–1075, 1997.</ref>. Medial temporal lobe structures such as the hippocampus and entorhinal cortex are especially vulnerable to early atrophic changes in AD<ref name="Du2004">A.T. Du, N. Schuff, J.H. Kramer, S. Ganzer, X.P. Zhu, W.J. Jagust, B.L. Miller, B.R. Reed, D. Mungas, K. Yaffe, H.C. Chui, and M.W. Weiner, "Higher atrophy rate of entorhinal cortex than hippocampus in AD", Neurology, 62:422–427, .</ref><ref name="Du2003">A.T. Du, N. Schuff, X.P. Zhu, W.J. Jagust, B.L. Miller, B.R. Reed, J.H. Kramer, D. Mungas, K. Yaffe, H.C. Chui, and M.W. Weiner, "Atrophy rates of entorhinal cortex in AD and normal aging", Neurology, 60:481–486, 2003.</ref><ref name="Jack2004"/>, and accelerated longitudinal tissue loss in these structures has been shown to precede the onset of cognitive impairment in subjects at risk<ref name="Fox1996">N.C. Fox, E.K. Warrington, P.A. Freeborough, P. Hartikainen, A.M. Kennedy, J.M. Stevens, and M.N. Rossor, "Presymptomatic hippocampal atrophy in Alzheimer's disease. A longitudinal MRI study", Brain, 119(6):2001–2007, 1996.</ref>.
We have recently shown that spatial patterns of regional atrophy provide better discrimination between MRI scans of cognitively normal and impaired individuals than a global or single regional atrophy measure alone<ref name="Davatzikos2008a">C. Davatzikos, Y. Fan, X. Wu, D. Shen, and S.M. Resnick, "Detection of prodromal Alzheimer's disease via pattern classification of magnetic resonance imaging", Neurobiol. Aging, 29:514–523, 2008.</ref>. Moreover, these high-dimensional pattern classification approaches may have additional utility in the differentiation between sub-types of dementia<ref name="Davatzikos2008b">C. Davatzikos, S.M. Resnick, X. Wu, P. Parmpi, and C.M. Clark, "Individual patient diagnosis of AD and FTD via high-dimensional pattern classification of MRI", Neuroimage, 41:1220–1227, 2008.</ref>. Subsequently, others have reported concordance between patterns of spatial atrophy detected in ante-mortem MRI studies and the distribution of neurofibrillary pathology in the brain at autopsy<ref name="Whitwell2008">J.L. Whitwell, K.A. Josephs, M.E. Murray, K. Kantarci, S.A. Przybelski, S.D. Weigand, P. Vemuri, M.L. Senjem, J.E. Parisi, D.S. Knopman, B.F. Boeve, R.C. Petersen, D.W. Dickson, and C.R. Jack Jr., "MRI correlates of neurofibrillary tangle pathology at autopsy: a voxel-based morphometry study", Neurology, 71:743–749, 2008.</ref>.
Recent studies suggest that the measurement of cortical thickness in vulnerable brain regions may also be a useful tool to detect perturbations in brain structure in cognitively normal subjects at risk for development of AD<ref name="Burggren2008">A.C. Burggren, M.M. Zeineh, A.D. Ekstrom, M.N. Braskie, P.M. Thompson, G.W. Small, and S.Y. Bookheimer, "Reduced cortical thickness in hippocampal subregions among cognitively normal apolipoprotein E e4 carriers", NeuroImage, 41:1177–1183, 2008.</ref> and in subjects with mild cognitive impairment (MCI)<ref name="Singh2006">V. Singh, H. Chertkow, J.P. Lerch, A.C. Evans, A.E. Dorr , and N.J. Kabani, "Spatial patterns of cortical thinning in mild cognitive impairment and Alzheimer's disease", Brain, 129:2885–2893, 2006.</ref>. Furthermore, decreases in cortical thickness appear to correlate well with severity of clinical impairment even in the earliest stages of AD <ref name="Dickerson2008">B.C. Dickerson, A. Bakkour, D.H. Salat, E. Feczko, J. Pacheco, D.N. Greve, F. Grodstein, C.I. Wright, D. Blacker, H.D. Rosas, R.A. Sperling, A. Atri, J.H. Growdon, B.T. Hyman, J.C. Morris, B. Fischl, and R.L. Buckner, "The cortical signature of Alzheimer's disease: regionally specific cortical thinning relates to symptom severity in very mild to mild AD dementia and is detectable in asymptomatic amyloid-positive individuals", Cereb. Cortex, 19(3):497–510, 2008.</ref>. These data indicate that cortical thickness may represent a more sensitive, and perhaps complementary, measure of early pathological change than standard MRI-based volumetry in subjects at risk for subsequent cognitive decline. However, these studies, while suggestive, are cross-sectional and are therefore limited in their ability to address the effects of age-related changes in cortical thickness over time.
We have previously reported cross-sectional age differences and 4-year longitudinal age changes in mean cortical thickness within eight sulcal regions in a subset of 35 older adults from the Baltimore Longitudinal Study of Aging (BLSA)<ref name="Rettmann2006">M.E. Rettmann, M.A. Kraut, J.L. Prince, and S.M. Resnick, "Cross-sectional and longitudinal analyses of anatomical sulcal changes associated with aging", Cereb. Cortex, 16:1584–1594, 2006.</ref>. In a cross-sectional study that also included young and middle-aged individuals, global cortical thinning was detectable by middle age with similar patterns of age differences in cortical thickness in both males and females <ref name="Salat2004">D.H. Salat, R.L. Buckner, A.Z. Snyder, D.N. Greve, R.S. Desikan, E. Busa, J.C. Morris, A.M. Dale, and B. Fischl, "Thinning of the cerebral cortex in aging", Cereb. Cortex, 14:721–730, 2004.</ref>. In the present study, we extend these investigations of cortical thickness through analysis of longitudinal changes in 66 older BLSA participants with up to eight serial imaging assessments. Furthermore, we determine whether age and sex influence rates of change in cortical thickness in older individuals during normal aging.
Materials and Methods
Subjects
This analysis included 66 individuals in the neuroimaging substudy of the BLSA<ref name="Resnick2000">S.M. Resnick, A.F. Goldszal, C. Davatzikos, S. Golski, M.A. Kraut, E.J. Metter, R.N. Bryan, and A.B. Zonderman, "One-year age changes in MRI brain volumes in older adults", Cerebral Cortex, 10:464–472, 2000.</ref> all of whom completed at least 6 annual follow up scans. Most of these participants (60 individuals) completed 8 annual follow up scans. The sample included 38 males and 28 females, with 37 and 26 right-handed males and females, respectively, ranging in age at baseline from 60 to 84 years. The following exclusionary criteria were applied to all entrants at baseline; central nervous system disease (epilepsy, stroke, bipolar illness, prior diagnosis of dementia according to diagnostic and statistical manual-III-R criteria (American Psychiatric Association, 1987), severe cardiovascular disease (myocardial infarction, coronary artery disease requiring angioplasty, or bypass surgery), severe pulmonary disease, or metastatic cancer. All participants remained free of dementia throughout the duration of their involvement in the present study. The research protocol was approved by the local Institutional Review Board, and written informed consent was obtained from all participants in conjunction with each neuroimaging visit.
Image Acquisition
The MRI acquisition of the brain volumes consisted of spoiled gradient echo (SPGR) volumetric magnetic resonance images, axially acquired, with the following parameters: TR = 35ms, TE = 5ms, flip angle = 45o, Image Matrix = 256 x 256, Field of View = 24cm, NEX = 1; voxel dimensions 0.9375 x 0.9375 x 1.5mm. Each data set was acquired on one of three GE Medical Systems Signa 1.5T scanners (GE Healthcare, Waukesha, WI).
Cortical Reconstruction
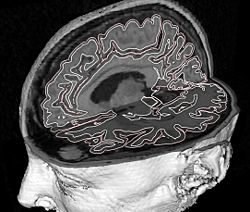
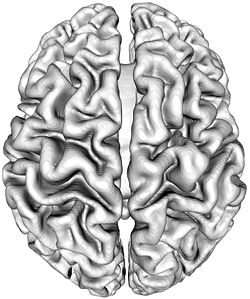
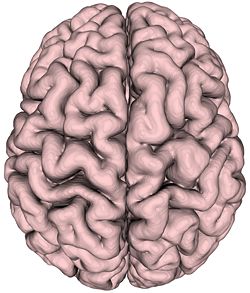
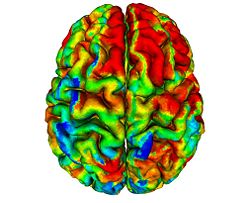
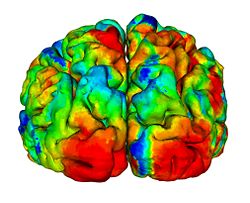
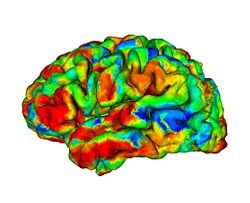
To reconstruct the cortical surface from acquired MR data, we used Cortical Reconstruction Using Implicit Surface Evolution (CRUISE)<ref name="Han2004">X. Han, D.L. Pham, D. Tosun, M.E. Rettmann, C. Xu, and J.L. Prince, "CRUISE: cortical reconstruction using implicit surface evolution", NeuroImage, 23:997–1012, 2004.</ref><ref name="Xu2000">C. Xu, X. Han, and J.L. Prince, "Improving cortical surface reconstruction accuracy using an anatomically consistent gray matter representation", Functional Human Brain Mapping, NeuroImage, S581, 2000.</ref>. This method has undergone extensive validation which is detailed in <ref name="Tosun2006">D. Tosun, M.E. Rettmann, D.Q. Naiman, S.M. Resnick, M.A. Kraut, and J.L. Prince, "Cortical reconstruction using implicit surface evolution: accuracy and precision analysis", NeuroImage, 29:838–852, 2006.</ref>. The CRUISE processing pipeline begins with a fuzzy tissue classification that is robust to noise and inhomogeneity artifacts<ref name="Pham2001">D.L. Pham, "Robust Fuzzy Segmentation of Magnetic Resonance Images", IEEE Symp. on Computer-based Medical Systems, Bethesda, MD, 127–131, 2001.</ref>. The classification provides three membership functions representing the fraction of WM, GM, and cerebrospinal fluid (CSF) present within a given voxel of the image. The next step creates masks of the ventricles and subcortical GM structures (e.g., putamen, thalamus) within the WM membership functions using<ref name="BazinPham2007">P.L. Bazin and D.L. Pham, "Topology-preserving tissue classification of magnetic resonance brain images", IEEE Trans. Med. Imag., 26:487–496, 2007.</ref>. Next, a triangulated surface mesh lying on the GM-WM boundary is computed as the 0.5 isolevel of the WM membership function. Noise, partial volume effects, and scanner artifacts cause the WM isosurface to contain “holes” and “handles” which are removed using a graph based correction algorithm<ref name="Han2002">X. Han, C. Xu, U. Braga-Neto, and J.L. Prince, "Topology correction in brain cortex segmentation using a multiscale, graph-based algorithm", IEEE Trans. Med. Imag., 21:109–121, 2001.</ref>. Because of the partial volume effect, opposing GM banks within narrow sulci are difficult to distinguish as separate banks. To address this problem, CRUISE automatically edits the GM membership function to create thin gaps between the banks of narrow sulci<ref name="Han2004" /><ref name="Xu2000" />. The final stage in CRUISE uses a topology preserving geometric deformable surface model<ref name="Han2003">X. Han, C. Xu, and J.L. Prince, "A topology preserving level set method for geometric deformable models", IEEE Trans. Patt. Anal. Mach. Intell., 25:755–768, 2003.</ref>, initialized at the GM/WM surface, which is driven toward the pial surface using forces derived from the edited GM membership function. Fig. 1 show results of typical CRUISE processing of MRI data to generation of surfaces.
Reliability Maps
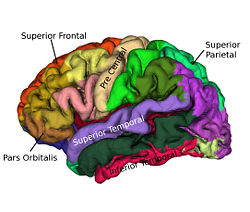
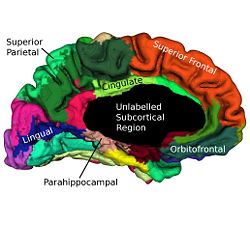
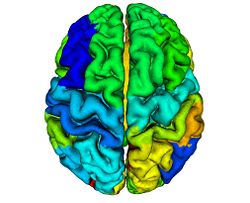
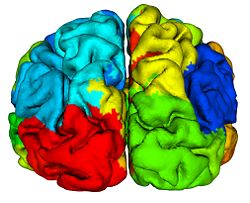
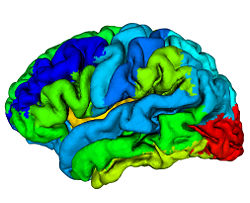
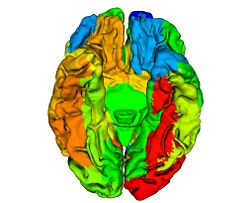
Cortical surfaces are automatically labeled using the “reliability map” approach of<ref name="Wan2008">J. Wan, A. Carass, S.M. Resnick, and J.L. Prince, "Automated reliable labeling of the cortical surface", Fifth IEEE International Symposium on Biomedical Imaging (ISBI 2008), Paris, France, May 14-17, 2008.</ref> which seeks to provide labels to regions that can be reliably labeled while leaving ambiguous regions unlabeled. The first step is to create a reliability map using a separate image database of labeled volumetric MRI scans<ref name="Desikan2006">R.S. Desikan, F. Segonne, B. Fischl, B.T. Quinn, B.C. Dickerson, D. Blacker, R.L. Buckner, A.M. Dale, R.P. Maguire, B.T. Hyman, M.S. Albert, and R.J. Killiany, "An automated labeling system for subdividing the human cerebral cortex on MRI scans into gyral based regions of interest", NeuroImage, 31:968–980, 2006.</ref>. The original data were T1-weighted magnetization prepared rapid gradient echo (MP-RAGE) volumetric scans comprising two sagittal acquisitions which were averaged to increase the contrast-to-noise ratio. The data were manually labeled within the image volumes yielding 33 labels per hemisphere; details can be found in<ref name="Desikan2006" />. In early validation trials of our algorithm (see below) we found that several regions were inconsistently labeled, so we merged these regions with adjacent regions, forming a superset of 20 labels per hemisphere. Fig. 2 shows the surface labels on one of the atlas brains. Thirty four of these atlases were found to be complete and suitable for our use. We randomly split the collection of “Desikan” atlases into two groups, where the first group of 17 became the atlas database while the second group of 17 were used to validate the approach<ref name="Wan2008" />. The reliability map <math>R_{A} (v)</math> for atlas brain <math>A</math> has values in the interval <math>[0, 1]</math> on each voxel <math>v</math> of <math>A</math>, describing how reliably this voxel can be deformably registered to a subject brain. We create <math>R_{A} (v)</math> as follows: Given <math>N (=17)</math> atlases <math>A_1, A_2, \ldots ,A_N</math> with labels <math>L_i (v)</math> on each voxel v we obtain <math>F_{A_i} (v)</math> by deformably registering <math>A_i</math> against each of <math>A_1, \ldots ,A _N,</math> (excluding <math>A_i</math>) using the Adaptive Bases Algorithm (ABA)<ref name="Rohde2003">G.K. Rohde, A. Aldroubi, and B.M. Dawant, "The adaptive bases algorithm for intensity-based nonrigid image registration", IEEE Trans. Med. Imag., 22:1470–1479, 2003.</ref>. We denote by <math>A_{1i}</math> the atlas <math>A_1</math> deformably registered to atlas <math>A_{i}, i = 2, \ldots ,N</math>. Then, <math>L_{1i} (v)</math> is found by deforming L_1 (v) using the corresponding deformation field. The reliability <math>R_{A_1} (v)</math> evaluates the degree of agreement of <math>L_{1i} (v)</math> with <math>L_i (v)</math>, as follows
- <math>R_{A_1} (v)= \frac{(\sum_{i=2}^N \delta(L_{1i} (v),L_i (v)))}{(N-1)},</math>
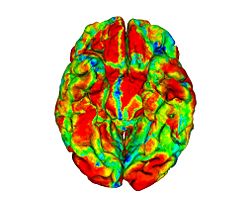
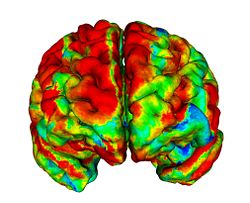
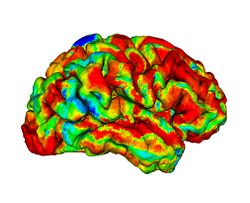
where, <math>\delta(a,b)</math> is the Kronecker delta. A reliability value of <math>1</math> at a given voxel means that that voxel has been mapped into the correct region (same label) for all <math>N-1</math> atlases. For each atlas we compute this reliability map relative to the other <math>N-1</math> atlases before labeling any subject not contained within the atlas. These reliability maps are defined on the atlas volumes, but can be mapped to any surface that happens to be defined within the volume. Fig. 3 shows a reliability map on a GM/CSF interface defined by CRUISE.
Labeling
For each atlas <math>A_i</math> we have labels <math>L_i(v)</math> and the reliability map <math>R_{A_i}(v)</math> for all voxels <math>v</math> of <math>A_i</math>. We label subject <math>S</math> using <math>M</math> atlases (<math>M \leq N</math>) as follows:
- 1. Register the <math>M</math> atlases to <math>S</math> and compute a voting score on each voxel that receives a given label. Let <math>L_{iS}(v)</math> denote the result of transforming the labels <math>L_i(v)</math> into <math>S</math> using the corresponding deformation field and <math>R_{iS}(v)</math> denotes the transformed reliability map. <math>V_j(v)</math> is the voting score that <math>v</math> receives the label <math>j</math> and is defined as follows
- <math>V_j(v) = \sum_{i=1}^{M} \delta(L_{iS}(v), j)R_{iS}(v)</math>
- where <math>j = 1, \ldots, K,</math> with <math>K</math> being the total number of labels in the atlas. For each voxel choose a candidate label <math>l</math> defined as <math>l = \mathrm{argmax}\{j:V_j(v)\}</math>.
- 2. For the candidate label, compute the average reliability value,
- <math>R_i(v) = \frac{\displaystyle{\sum_{i=1}^M \delta\left(L_{iS}(v), l\right) R_{iS}(v)}}{\displaystyle{\sum_{i=1}^M \delta\left(L_{iS}(v), l\right)}}</math>
- We assign the label l to the voxel <math>v</math> if <math>R(v)</math> is larger than a threshold <math>t</math>, otherwise we leave the voxel unlabeled. That is,
- <math>L_S(v) = \left\{\begin{array}{ll}l,& \mbox{if } R(v) \geq t,\\0,&\mbox{otherwise.}\\\end{array}\right.</math>
- We choose <math>M</math> in order to reduce the number of registrations required without affecting the accuracy of the results. In <ref name="Wan2008"/> it was demonstrated that choosing <math>M = 3</math> yielded improvements over a traditional voting scheme with five atlases. It was also determined that use of the threshold <math>t = 0.80</math> yielded satisfactory results, so that is the value we use in the present work.
Thickness
We use the thickness estimation method described in <ref name="Han2001">X. Han, C. Xu, D. Tosun, and J.L. Prince, "Cortical surface reconstruction using a topology preserving geometric deformable model", IEEE Workshop on Mathematical Methods in Biomedical Image Analysis (MMBIA 2001), Kauai, Hawaii, December 9-10, 2001.</ref> to compute cortical thickness. In this approach, cortical thickness is computed from the image volume using two distance transforms, one computed from the inner surface and one computed from the outer surface. A thickness value is assigned to each voxel in the volume between the two surfaces and is defined as the sum of the distances from the voxel to each of the two surfaces. The reconstructed central cortical surface is generated in the same coordinate space as the image volume, which means that each vertex of its surface mesh can obtain image values by directly mapping into the image data in the volume. Accordingly, we obtain measures of cortical thickness at each surface vertex of the central cortical surface using trilinear interpolation applied in the image volume containing estimates of cortical thickness at volumetric grid points.
To test the repeatability of our thickness measures, we used the repeat scan data available from the Open Access Series of Imaging Studies (OASIS) project <ref name="Marcus2007">D.S. Marcus, T.H. Wang, J. Parker, J.G. Csernansky, J.C. Morris, and R.L. Buckner, "Open Access Series of Imaging Studies (OASIS): cross-sectional MRI data in young, middle aged, nondemented, and demented older adults", J. Cogn. Neurosci., 19:1498–1507, 2007.</ref>. From the OASIS data pool we took ten subjects, each with two scans, and used the same processing steps to generate our thickness estimates for each of the regions of interest. We then did a test–retest analysis to determine the consistency of the measurements for a given subject. Test–retest correlation values range from − 1.0 to 1.0, and values above 0.75 are considered to represent very good test–retest reliability. The values from our ten subjects were between 0.833 and 0.968, with an average test–retest correlation of 0.902. In addition, the mean intraclass correlation coefficient (ICC) (S.D.) across regions in these subjects was 0.6 (0.22). In our analysis of cortical thickness changes in aging, we analyze each volume independently in carrying out computations leading to cortical thickness measurements, and we use statistical analysis to analyze the resulting thickness data.
Statistical analysis
Linear mixed effects models were used in our analyses <ref name="HartleyRao1967">H.O. Hartley and J.N.K. Rao, "Maximum-likelihood estimation for mixed analysis of variance model", Biometrika, 54(1/2):93–108, 1967.</ref> and <ref name="LairdWare1982">N.M. Laird and J.H. Ware, "Random-effects models for longitudinal data", Biometrics, 38:963–974, 1982.</ref>. The main characteristic of the longitudinal data is that data points within each subject are correlated and mixed effects models take into account these correlations as part of the estimation process by including random effects, thus making the parameter estimates unbiased and more efficient. The models were fit using the lme function from the nlme package <ref name="PinheiroBates2000">J.C. Pinheiro and D.M. Bates, "Mixed-Effects Models in S and S-PLUS", Springer, New York, 2000.</ref> in R version 2.9.0.
We used the median thickness values for each of the 40 ROIs as our dependent variables. There were two goals in this longitudinal study; i.e. characterization of the age-related growth–decline curve and estimation of longitudinal rates of change and sex differences in those changes. These goals were incorporated into the following analyses. We first used a backward elimination from a full model for each gyral region of age * sex and age * scanner which showed that the sex term was significant in some regions while the scanner term never reached significance. We therefore removed scanner as a potential predictor in all remaining analyses. In the next round of analyses, we fit linear mixed effects models with a quadratic functional form in age to the data. This allowed us to test if the observed longitudinal changes were linear or nonlinear. The fixed-effect part of this model included intercept, sex, age, age * age, and sex interactions with age and age * age as predictors. The initial random-effect part of the model included intercept, age, and age * age. In the subsequent round of analyses, we used models with linear longitudinal changes to estimate rates of change. The fixed-effect part of this model included intercept, sex, age, and sex * age as predictors. The initial random-effect part of the model included intercept and age. All the model reductions started from random effects. Non-significant random effects were dropped from the model.
The restricted maximum likelihood (REML) method was used in all models because it produces unbiased estimates of variance and covariance parameters. The age variable was centered at 60 and divided by 10. This means the intercept is the level at age 60 and change is measured in decades. Effect coding was used for the sex variable (− 0.5 for females and 0.5 for males). This parameterization allowed us to estimate sex-adjusted longitudinal changes and the sex difference in longitudinal changes at the same time.
Results
Discussion
Our principal objective in this study was to delineate the regional distribution of longitudinal changes in thickness across the entire cortical mantle during normal aging in older adults. To accomplish this goal, we analyzed cortical thickness measures in 20 distinct gyral regions of interest (ROIs) in each cerebral hemisphere from 66 non-demented older individuals in the neuroimaging substudy of the BLSA. We derived these data from MRI measures obtained during annual serial neuroimaging with up to 8 annual follow-up assessments. We observe significant and widespread longitudinal declines in cortical thickness during aging, differential rates of decline in distinct cortical regions, and robust differences in rates of cortical thinning in several regions between males and females.
Structural neuroimaging studies of the aging brain have largely focused on volumetric measures of the cerebral cortex <ref name="Coffey1992">C.E. Coffey, W.E. Wilkinson, I.A. Parashos, S.A. Soady, R.J. Sullivan, L.J. Patterson, G.S. Figiel, M.C. Webb, C.E. Spritzer, and W.T. Djang, "Quantitative cerebral anatomy of the aging human brain: a cross-sectional study using magnetic resonance imaging", Neurology, 42:527–536, 1992.</ref><ref name="Good2001">C.D. Good, I.S. Johnsrude, J. Ashburner, R.N. Henson, K.J. Friston, and R.S. Frackowiak, "A voxel-based morphometric study of ageing in 465 normal adult human brains", NeuroImage, 14:21–36, 2001.</ref><ref name="Liu2003">R.S. Liu, L. Lemieux, G.S. Bell, S.M. Sisodiya, S.D. Shorvon, J.W. Sander, and J.S. Duncan, "A longitudinal study of brain morphometrics using quantitative magnetic resonance imaging and difference image analysis", NeuroImage, 20:22–33, 2003.</ref><ref name="Resnick2000">S.M. Resnick, A.F. Goldszal, C. Davatzikos, S. Golski, M.A. Kraut, E.J. Metter, R.N. Bryan, and A.B. Zonderman, "One-year age changes in MRI brain volumes in older adults", Cereb. Cortex, 10:464–472, 2000.</ref><ref name="Scahill2003">R.I. Scahill, C. Frost, R. Jenkins, J.L. Whitwell, M.N. Rossor, and N.C. Fox, "A longitudinal study of brain volume changes in normal aging using serial registered magnetic resonance imaging", Arch. Neurol., 60:989–994, 2003.</ref><ref name="Tang2001">Y. Tang, G.T. Whitman, I. Lopez, and R.W. Baloh, "Brain volume changes on longitudinal magnetic resonance imaging in normal older people", J. Neuroimaging, 11:393–400, 2001.</ref>. This metric is however a composite measure derived from the product of cortical surface area and cortical thickness, each of which may in turn, be differentially affected during aging by a variety of genetic and/or environmental influences <ref name="Panizzon2009">M.S. Panizzon, C. Fennema-Notestine, L.T. Eyler, T.L. Jernigan, E. Prom-Wormley, M. Neale, K. Jacobson, M.J. Lyons, M.D. Grant, C.E. Franz, H. Xian, M. Tsuang, B. Fischl, L. Seidman, A. Dale, and W.S. Kremen, "Distinct genetic influences on cortical surface area and cortical thickness", Cereb. Cortex, 19(11):2728–2735, 2009.</ref>. It is therefore surprising that there have been relatively few studies focusing on the analyses of cortical thickness or surface area as discrete measures in aging. Another feature of the majority of structural neuroimaging studies of the aging brain is their cross-sectional design <ref name="Blatter1995">D.D. Blatter, E.D. Bigler, S.D. Gale, S.C. Johnson, C.V. Anderson, B.M. Burnett, N. Parker, S. Kurth, and S.D. Horn, "Quantitative volumetric analysis of brain MR: normative database spanning 5 decades of life", AJNR Am. J. Neuroradiol., 16:241–251, 1995.</ref><ref name="Courchesne2000">E. Courchesne, H.J. Chisum, J. Townsend, A. Cowles, J. Covington, B. Egaas, M. Harwood, S. Hinds, and G.A. Press, "Normal brain development and aging: quantitative analysis at in vivo MR imaging in healthy volunteers", Radiology, 216:672–682, 2000.</ref><ref name="Pfefferbaum1994">A. Pfefferbaum, D.H. Mathalon, E.V. Sullivan, J.M. Rawles, R.B. Zipursky, and K.O. Lim, "A quantitative magnetic resonance imaging study of changes in brain morphology from infancy to late adulthood", Arch. Neurol., 51:874–887, 1994.</ref><ref name="Sowell2004">E.R. Sowell, P.M. Thompson, and A.W. Toga, "Mapping changes in the human cortex throughout the span of life", Neuroscientist, 10:372–392, 2004.</ref>. These studies may be somewhat limited in their ability to account for large inter-individual variability to changes in brain structure and are restricted to studying the effect of chronological age on the brain <ref name="Fjell2009">A.M. Fjell, L.T. Westlye, I. Amlien, T. Espeseth, I. Reinvang, N. Raz, I. Agartz, D.H. Salat, D.N. Greve, B. Fischl, A.M. Dale, and K.B. Walhovd, "High consistency of regional cortical thinning in aging across multiple samples", Cereb. Cortex, 19(9):2001–2012, 2009.</ref>. On the other hand, by incorporating data from multiple time points, longitudinal studies are able to address intra-individual effects of the process of aging on brain structure. Such studies have revealed regional patterns of change over time in brain regions that are distinct from those observed in cross-sectional studies alone <ref name="Du2006">A.T. Du, N. Schuff, L.L. Chao, J. Kornak, W.J. Jagust, J.H. Kramer, B.R. Reed, B.L. Miller, D. Norman, H.C. Chui, and M.W. Weiner, "Age effects on atrophy rates of entorhinal cortex and hippocampus", Neurobiol. Aging, 27:733–740, 2006.</ref><ref name="Raz1997">N. Raz, F.M. Gunning, D. Head, J.H. Dupuis, J. McQuain, S.D. Briggs, W.J. Loken, A.E. Thornton, and J.D. Acker, "Selective aging of the human cerebral cortex observed in vivo: differential vulnerability of the prefrontal gray matter", Cereb. Cortex, 7:268–282, 1997.</ref>.
The main finding in this study is that age-related decline in cortical thickness is widespread, but shows an anterior–posterior gradient with frontal and parietal regions, in general, exhibiting greater rates of decline than temporal and occipital. This observation is in agreement with an earlier study where we showed a similar pattern of longitudinal decline in gray matter volumes across the brain during normal aging <ref name="Resnick2003"/>. Our results are also consistent with an earlier study from our group where we investigated longitudinal changes in a variety of sulcal anatomical measures during normal aging in a subgroup of these older participants over a 4-year follow-up interval <ref name="Rettmann2006"/>. More recently, a large cross-sectional study on more than 800 individuals ranging in age from 18–93 years demonstrated similar patterns of widespread age-related declines in cortical thickness <ref name="Fjell2009"/>.
It is interesting to note in this context that recent studies suggest that measurements of cortical thickness may be particularly sensitive to early detection of neuropathology within vulnerable brain regions in subjects at risk for AD. A recent cross-sectional study showed that measurements of cortical thickness in the entorhinal cortex (ERC) might be sensitive to detection of pre-symptomatic pathological changes in older individuals at risk for AD <ref name="Burggren2008"/>. Furthermore, this report suggests that measurements of cortical thickness in such individuals may be more sensitive to early pre-clinical pathological changes than standard MRI-based volumetry. Taken together with the findings in our current study, these results may indicate utility of cortical thickness measurements as complementary end points in clinical trials of disease-modifying treatments in subjects at risk for subsequent development of AD.
Our findings of relatively large declines in cortical thickness in the precuneus and cingulate regions are also interesting in the light of previous functional neuroimaging studies that show hypometabolism in these regions to be an early and distinctive feature of AD and mild cognitive impairment (MCI) <ref name="Herholz2007">K. Herholz, S.F. Carter, and M. Jones, "Positron emission tomography imaging in dementia", Br J Radiol, 80(2):S160–S167, 2007.</ref><ref name="Matsuda2007">H. Matsuda, "The role of neuroimaging in mild cognitive impairment", Neuropathology, 27:570–577, 2007.</ref>. This suggests that our observation of decreases in cortical thickness in these regions even in cognitively normal older adults may represent an early and distinct anatomical signature of brain regions at risk for functional decline. In the context of recent neuroimaging studies using the amyloid tracer 11C[PIB] to study in vivo burden of fibrillar amyloid in the brain, the pattern of decline in cortical thickness observed in the current study appears to be somewhat similar to that of amyloid accumulation in older individuals, affecting predominantly frontal and parietal brain regions more than temporal and occipital <ref name="Pike2007">K.E. Pike, G. Savage, V.L. Villemagne, S. Ng, S.A. Moss, P. Maruff, C.A. Mathis, W.E. Klunk, C.L. Masters, and C.C. Rowe, "Beta-amyloid imaging and memory in non-demented individuals: evidence for preclinical Alzheimer's disease", Brain, 130:2837–2844, 2007.</ref><ref name="Rowe2007">C.C. Rowe, S. Ng, U. Ackermann, S.J. Gong, K. Pike, G. Savage, T.F. Cowie, K.L. Dickinson, P. Maruff, D. Darby, C. Smith, M. Woodward, J. Merory, H. Tochon-Danguy, G. O'Keefe, W.E. Klunk, C.A. Mathis, J.C. Price, C.L. Masters, and V.L. Villemagne, "Imaging beta-amyloid burden in aging and dementia", Neurology, 68:1718–1725, 2007.</ref>. We have recently also combined [15O]water and 11C [PIB] PET to examine differences in longitudinal changes in regional cerebral blood flow (rCBF) between cognitively normal older individuals dichotomized into those with high and low mean cortical fibrillar amyloid burden. We observed both significant increases and decreases in rCBF in several brain regions between the groups <ref name="Sojkova2008">J. Sojkova, L. Beason-Held, Y. Zhou, Y. An, M.A. Kraut, W. Ye, L. Ferrucci, C.A. Mathis, W.E. Klunk, D.F. Wong, and S.M. Resnick, "Longitudinal cerebral blood flow and amyloid deposition: an emerging pattern?", J. Nucl. Med., 49:1465–1471, 2008.</ref>. Interestingly, all the regions exhibiting significant longitudinal changes in rCBF in those with high amyloid burden are those that also show significant declines in cortical thickness in the present study, suggesting at least in some regions that the latter measure is related to changes in brain function during aging.
We also observed significant sex differences in rates of decline in cortical thickness in several brain regions including middle frontal, inferior parietal, superior parietal, postcentral, parahippocampal, precuneus, cingulate, and superior temporal gyri. The pattern of declines in all these regions indicated greater rates of atrophy in men relative to women. This finding is consistent with previous cross-sectional and longitudinal studies, including our own that used volumetric MRI measures to analyze changes in brain volume during normal aging <ref name="Coffey1998">C.E. Coffey, J.F. Lucke, J.A. Saxton, G. Ratcliff, L.J. Unitas, B. Billig, and R.N. Bryan, "Sex differences in brain aging: a quantitative magnetic resonance imaging study", Arch. Neurol., 55:169–179, 1998.</ref><ref name="Cowell1994">P.E. Cowell, B.I. Turetsky, R.C. Gur, R.I. Grossman, D.L. Shtasel, and R.E. Gur, "Sex differences in aging of the human frontal and temporal lobes", J. Neurosci., 14:4748–4755, 1994.</ref><ref name="Gur1991">R.C. Gur, P.D. Mozley, S.M. Resnick, G.L. Gottlieb, M. Kohn, R. Zimmerman, G. Herman, S. Atlas, R. Grossman, and D. Berretta et al., "Gender differences in age effect on brain atrophy measured by magnetic resonance imaging", Proc. Natl. Acad. Sci. U. S. A., 88:2845–2849, 1991.</ref><ref name="Resnick2000"/>. Some of these regions, including middle frontal, parahippocampal and superior parietal gyri were also observed to exhibit similar sex differences in rates of atrophy in a recent longitudinal study of changes in brain volume during normal aging <ref name="Driscoll2009"/>.
Some additional findings in this study that merit consideration include apparent increases in cortical thickness during aging in the left lingual and fusiform regions. Other studies have observed similar increases in the medial frontal region. Although intriguing, we have not directly addressed the likely mechanisms underlying this observation. One plausible explanation may be that decreases in gray white contrast during aging might result in apparent increases in cortical thickness estimates. Our group <ref name="DavatzikosResnick2002">C. Davatzikos and S.M. Resnick, "Degenerative age changes in white matter connectivity visualized in vivo using magnetic resonance imaging", Cereb. Cortex, 12(7):767–771, 2002.</ref> as well as others <ref name="Salat2009">D.H. Salat, S.Y. Lee, A.J. van der Kouwe, D.N. Greve, B. Fischl, and H.D. Rosas, "Age-associated alterations in cortical gray and white matter signal intensity and gray to white matter contrast", NeuroImage, 48:21–28, 2009.</ref> have observed that in some brain regions, statistical effects of changes in gray–white contrast during aging may be stronger than those attributable to cortical thinning <ref name="Salat2009"/>. We also observed striking hemispheric differences in rates of change in cortical thickness in the temporal lobe, with far greater decreases in cortical thickness in the left hemisphere relative to right. Hemispheric asymmetry in patterns of volume changes in the normal aging brain have been previously reported, although these observations have been inconsistent <ref name="Raz2004">N. Raz, F. Gunning-Dixon, D. Head, K.M. Rodrigue, A. Williamson, and J.D. Acker, "Aging, sexual dimorphism, and hemispheric asymmetry of the cerebral cortex: replicability of regional differences in volume", Neurobiol. Aging, 25:377–396, 2004.</ref>.
We are aware that some caveats are to be considered in the interpretation of our results. Since our principal aim was to undertake an exploratory analysis of the longitudinal changes in cortical thickness across the entire cortical mantle, we have chosen to present results from all brain regions examined without corrections for multiple hypotheses testing. While this might increase the risk of type-I error, we believe that our approach now allows for further directed analyses of age-related changes in specific brain regions as well as testing a priori hypotheses on the role of biological modifiers of such changes. There is also the possibility that substantial effects might occur in a focal region that falls across the boundary of a gyral region and therefore fail to reach significance within either region. Other authors have addressed this problem by performing statistical analysis point-by-point across the entire cortical mantle after registration of multiple subjects to a common atlas <ref name="Salat2004"/>. However, it is important to point out that these methods have the potential to mix registration errors with actual effects, and they also smooth the thickness values by large amounts (e.g., approximating a Gaussian kernel of 22 mm full-width at half-maximum). The net effect of these steps could account for the fact that significance is not achieved in most cortical areas in these other works (see Fig. 3 in Salat et al., 2004). Our approach is fundamentally different in that it pools data from regions that are conceptually registered according to their gyral label, which removes the potential effects of registration errors. Our approach also averages over regions of the cortex in order to reduce noise in thickness measurements, and these regions are histologically meaningful. Our pursuit of this approach was specifically carried out in order to find more statistically significant relationships than is generally achieved in longitudinal analyses.
It might be asked what effect our particular labeling approach might have on our results. We have run comparisons of our labeling approach against Freesurfer <ref name="Makris2005">N. Makris, J.E. Schlerf, S.M. Hodge, C. Haselgrove, M.D. Albaugh, L.J. Seidman, S.L. Rauch, G. Harris, J. Biederman, V.S. Caviness Jr., D.N. Kennedy, and J.D. Schmahmann, "MRI-based surface-assisted parcellation of human cerebellar cortex: an anatomically specified method with estimate of reliability", NeuroImage, 25:pp. 1146–1160, 2005.</ref> and found Dice coefficients falling around 0.75–0.85, which indicates reasonable agreement. Most of the disagreement can be found at the edges of gyral regions in part because Freesurfer gyral boundaries tend to be smoother than ours. The main reason that we investigated the concept of reliability was because of these differences—both variations in our own labeling on different brains as well as the differences between competing methods such as Freesurfer. Though we have not demonstrated this experimentally, we believe that through the use of reliability, our median thickness measurements arise from points on the surface that would in large part be labeled the same by either Freesurfer or CRUISE.
Finally, like other automatic algorithms, CRUISE also shows the gyri around the central sulcus to be thinner than what is expected according to histology. Hutton et al. (2008) speculate that the reason for this difference might be related to contrast differences between gray matter and white matter in this particular region of the brain. We believe that the contrast in this region is not substantially different than elsewhere but that because the histology of these regions is substantially different than others on the cortex—e.g., large Betz neurons and large white matter tracts—the location of the edge of T1 contrast shifts outward. As well, this region provides a very strong edge (though outward from what histology might decide is the actual edge of the gray matter) and it is found very accurately by CRUISE and other automatic algorithms. This may account for the much lower “noise” in the measurements in these regions.
|
|
|
Conclusion
We have undertaken a longitudinal study in cognitively normal older individuals where we derived automated measurements of cortical surface thickness across the entire cortical mantle. Our results show widespread declines in cortical thickness during normal aging and differential rates of cortical thinning in distinct brain regions. In the light of previous functional neuroimaging studies both in normal controls as well as in those with established AD, this study demonstrates the utility of cortical thickness as a potentially useful neuroanatomical correlate of normal and perturbed brain function in health and disease.
Acknowledgments
This research was supported in part by the Intramural Research Program of the NIH, National Institute on Aging. Partial support was provided by the National Institute of Neurological Disorders and Stroke (NINDS), a part of the National Institute of Health (NIH), through grants R01-NS37747, RO1-AG016324 and R01-NS054255. The authors have no known conflicts of interest. The atlas data was provided by Dr. Bruce Fischl, Martinos Center for Biomedical Imaging, and supported by the NCRR through grants P41-RR14075 and R01 RR16594-01A1 and by the NIH/NINDS through grant R01 NS052585-01. We are grateful to the BLSA participants and neuroimaging staff for their dedication to these studies.
